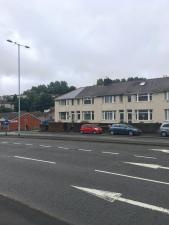
Swansea Roadside
Latest Data: Updated 13/12/2025 20:00 GMT
| Parameter | Index | Band | Concentration | Period |
|---|---|---|---|---|
| PM10 | 2 | LOW | 20 µg/m3 (Ref.eq) | 24 Hour mean |
| PM2.5 | 2 | LOW | 12 µg/m3 (BAM) | 24 Hour mean |
| NO2 | 1 | LOW | 19 µg/m3 | hourly mean |
| NOXasNO2 | No Data | 33 µg/m3 | hourly mean | |
| NO | No Data | 9 µg/m3 | hourly mean | |
Note: Values are based on provisional data. Data are GMT hour ending.
For more information on this monitoring data please contact this local authority at .
Mouse-over the graph to access further tools to analysis the data.
View last:
| Parameter | Parameter Name |
|---|---|
| NO | Nitric Oxide |
| NO2 | Nitrogen dioxide |
| NOXasNO2 | Nitrogen oxides as nitrogen dioxide |
| GE10 | Particulates < 10um (hourly measured) |
| PM25 | Particulates < 2.5um (hourly measured) |
Statistics for Swansea Roadside
| Site Name | Swansea Roadside |
|---|---|
| Site Type | Roadside |
| Easting, Northing | 265319, 194451 |
| Latitude, Longitude | 51.632696, -3.947374 |
| OS Grid Ref | SS6604095409 |
| Address | |
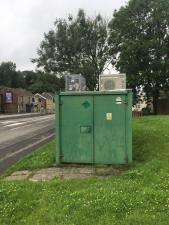
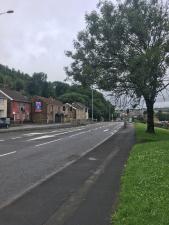
| Site Comments | The Swansea AURN (Automatic Urban and Rural Network) has been affiliated into the UK National Network since 1994 and has been operational ever since. The site was relocated from Castle Gardens in 1995 to Princess Way in the city centre. This site has itself now been decommissioned during August 2006 and relocated to its present location along the A483 Carmarthen road due to redevelopment works within the city centre. The site now has a classification of Roadside. The site picture shows a view of the Swansea AURN looking north towards Cwm Level roundabout. The main city centre shopping area is located approximately a mile and a half to the south this location. |
| Monitoring Network: Welsh Automatic Urban pollution Monitoring | ||
|---|---|---|
| Parameter | Date Started | Date Ended |
| Sulphur dioxide | 20/09/2006 | 30/09/2007 |
| Volatile PM2.5 (Hourly measured) | 20/09/2006 | 16/11/2011 |
| Nitrogen oxides as nitrogen dioxide | 20/09/2006 | |
| Modelled Wind Direction | 01/08/2010 | |
| Non-volatile PM10 (Hourly measured) | 20/09/2006 | 16/11/2011 |
| Carbon Monoxide | 20/09/2006 | 30/09/2007 |
| Particulates < 10um (hourly measured) | 20/09/2006 | |
| Ozone | 20/09/2006 | 30/09/2007 |
| Volatile PM10 (Hourly measured) | 20/09/2006 | 16/11/2011 |
| Nitric Oxide | 20/09/2006 | |
| Modelled Temperature | 01/08/2010 | |
| Particulates < 2.5um (hourly measured) | 20/09/2006 | |
| Non-volatile PM2.5 (Hourly measured) | 20/09/2006 | 16/11/2011 |
| Nitrogen dioxide | 20/09/2006 | |
| Modelled Wind Speed | 01/08/2010 | |
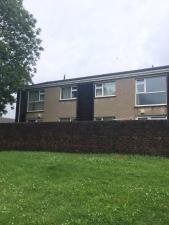
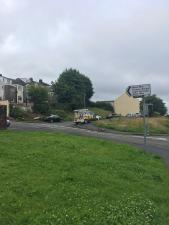
The photographs show the site itself, and views looking North, East, South and West.
Click the button below to create the PDF statistics report for the chosen year and site above. Please note that it is stated within the report text itself whether data used to create the statistical report is ratified or provisional.
Note: it may take a few seconds to generate the report.


