

The number of automatic monitoring sites in Wales has increased greatly in recent years. While this helps to improve our understanding of air quality across the country, it potentially complicates the investigation of how air quality has changed over time. If such investigations are based on all available data, discontinuities and false trends may be introduced because of changes in the composition of the network. Here, investigation of changes has been based on subsets of long-running sites rather than on every site in the network. This should lead to a more robust assessment.
Nitrogen Dioxide
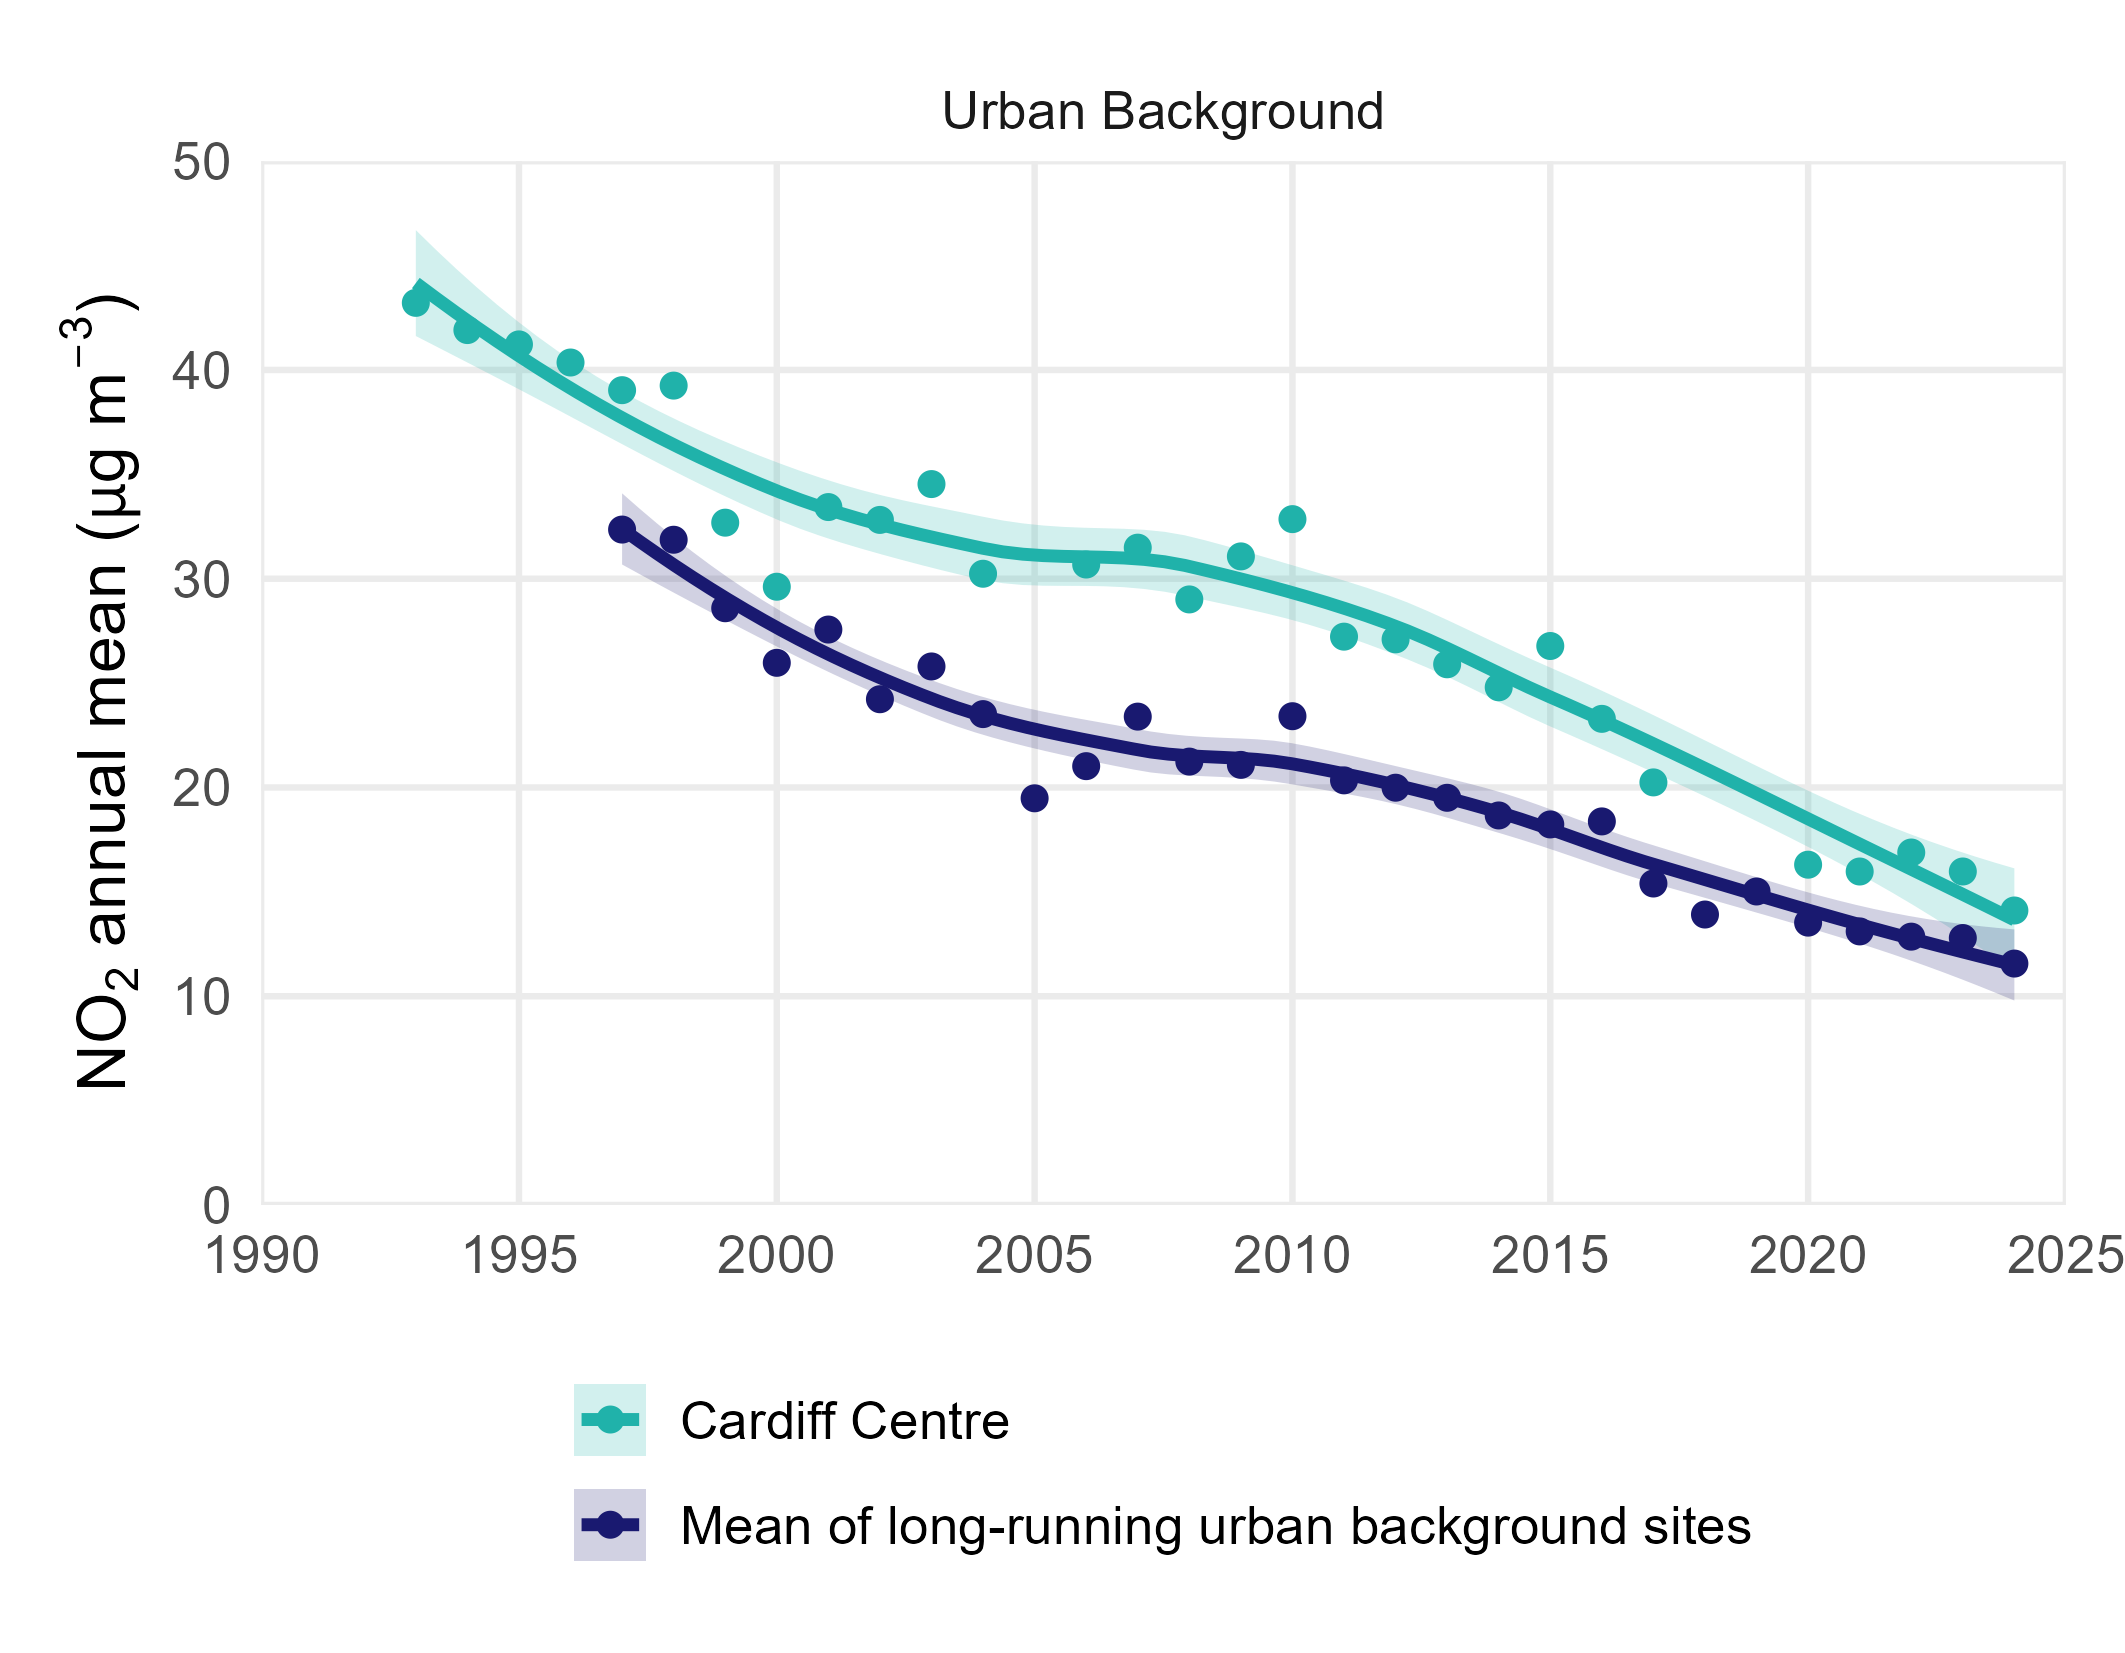
In Wales (and the rest of the UK), the most widely exceeded limit value is the annual mean nitrogen dioxide concentration (40 μg m-3). The figure below shows how annual mean nitrogen dioxide concentrations have varied with time.
Urban background sites are represented by the longest running site of this type (Cardiff Centre) from 1992, and the mean of all urban background long-running sites. At urban background sites, a consistent decline in NO2 concentrations has been observed since 1997. In comparison to urban traffic sites, urban background sites experienced the lowest annual mean concentration of NO2 on record in 2024 at 11.6 µg m-3. This indicates that these sites experienced relatively lower influence from COVID-19 restrictions. This is primarily due to their considerable distance from major roads and reduced exposure to vehicular emissions.
Urban traffic monitoring sites, defined as those situated within 10 meters of a major road, are represented by the longest-running roadside site (Swansea Morriston Roadside) in operation since 2001 and the mean of all urban traffic long-running sites.
The annual mean concentration of NO2 at Welsh urban traffic sites has exhibited a consistent decline from 33.8 µg m-3 in 2008 to 19.4 µg m-3 in 2024. Notably, 2020 marked a record low in annual mean NO2 concentrations largely attributed to the decreased vehicular traffic resulting from COVID-19 restrictions. Following this in 2021, there was a notable upturn in annual mean concentrations, corresponding to the gradual easing of restrictions.

Particulate Matter
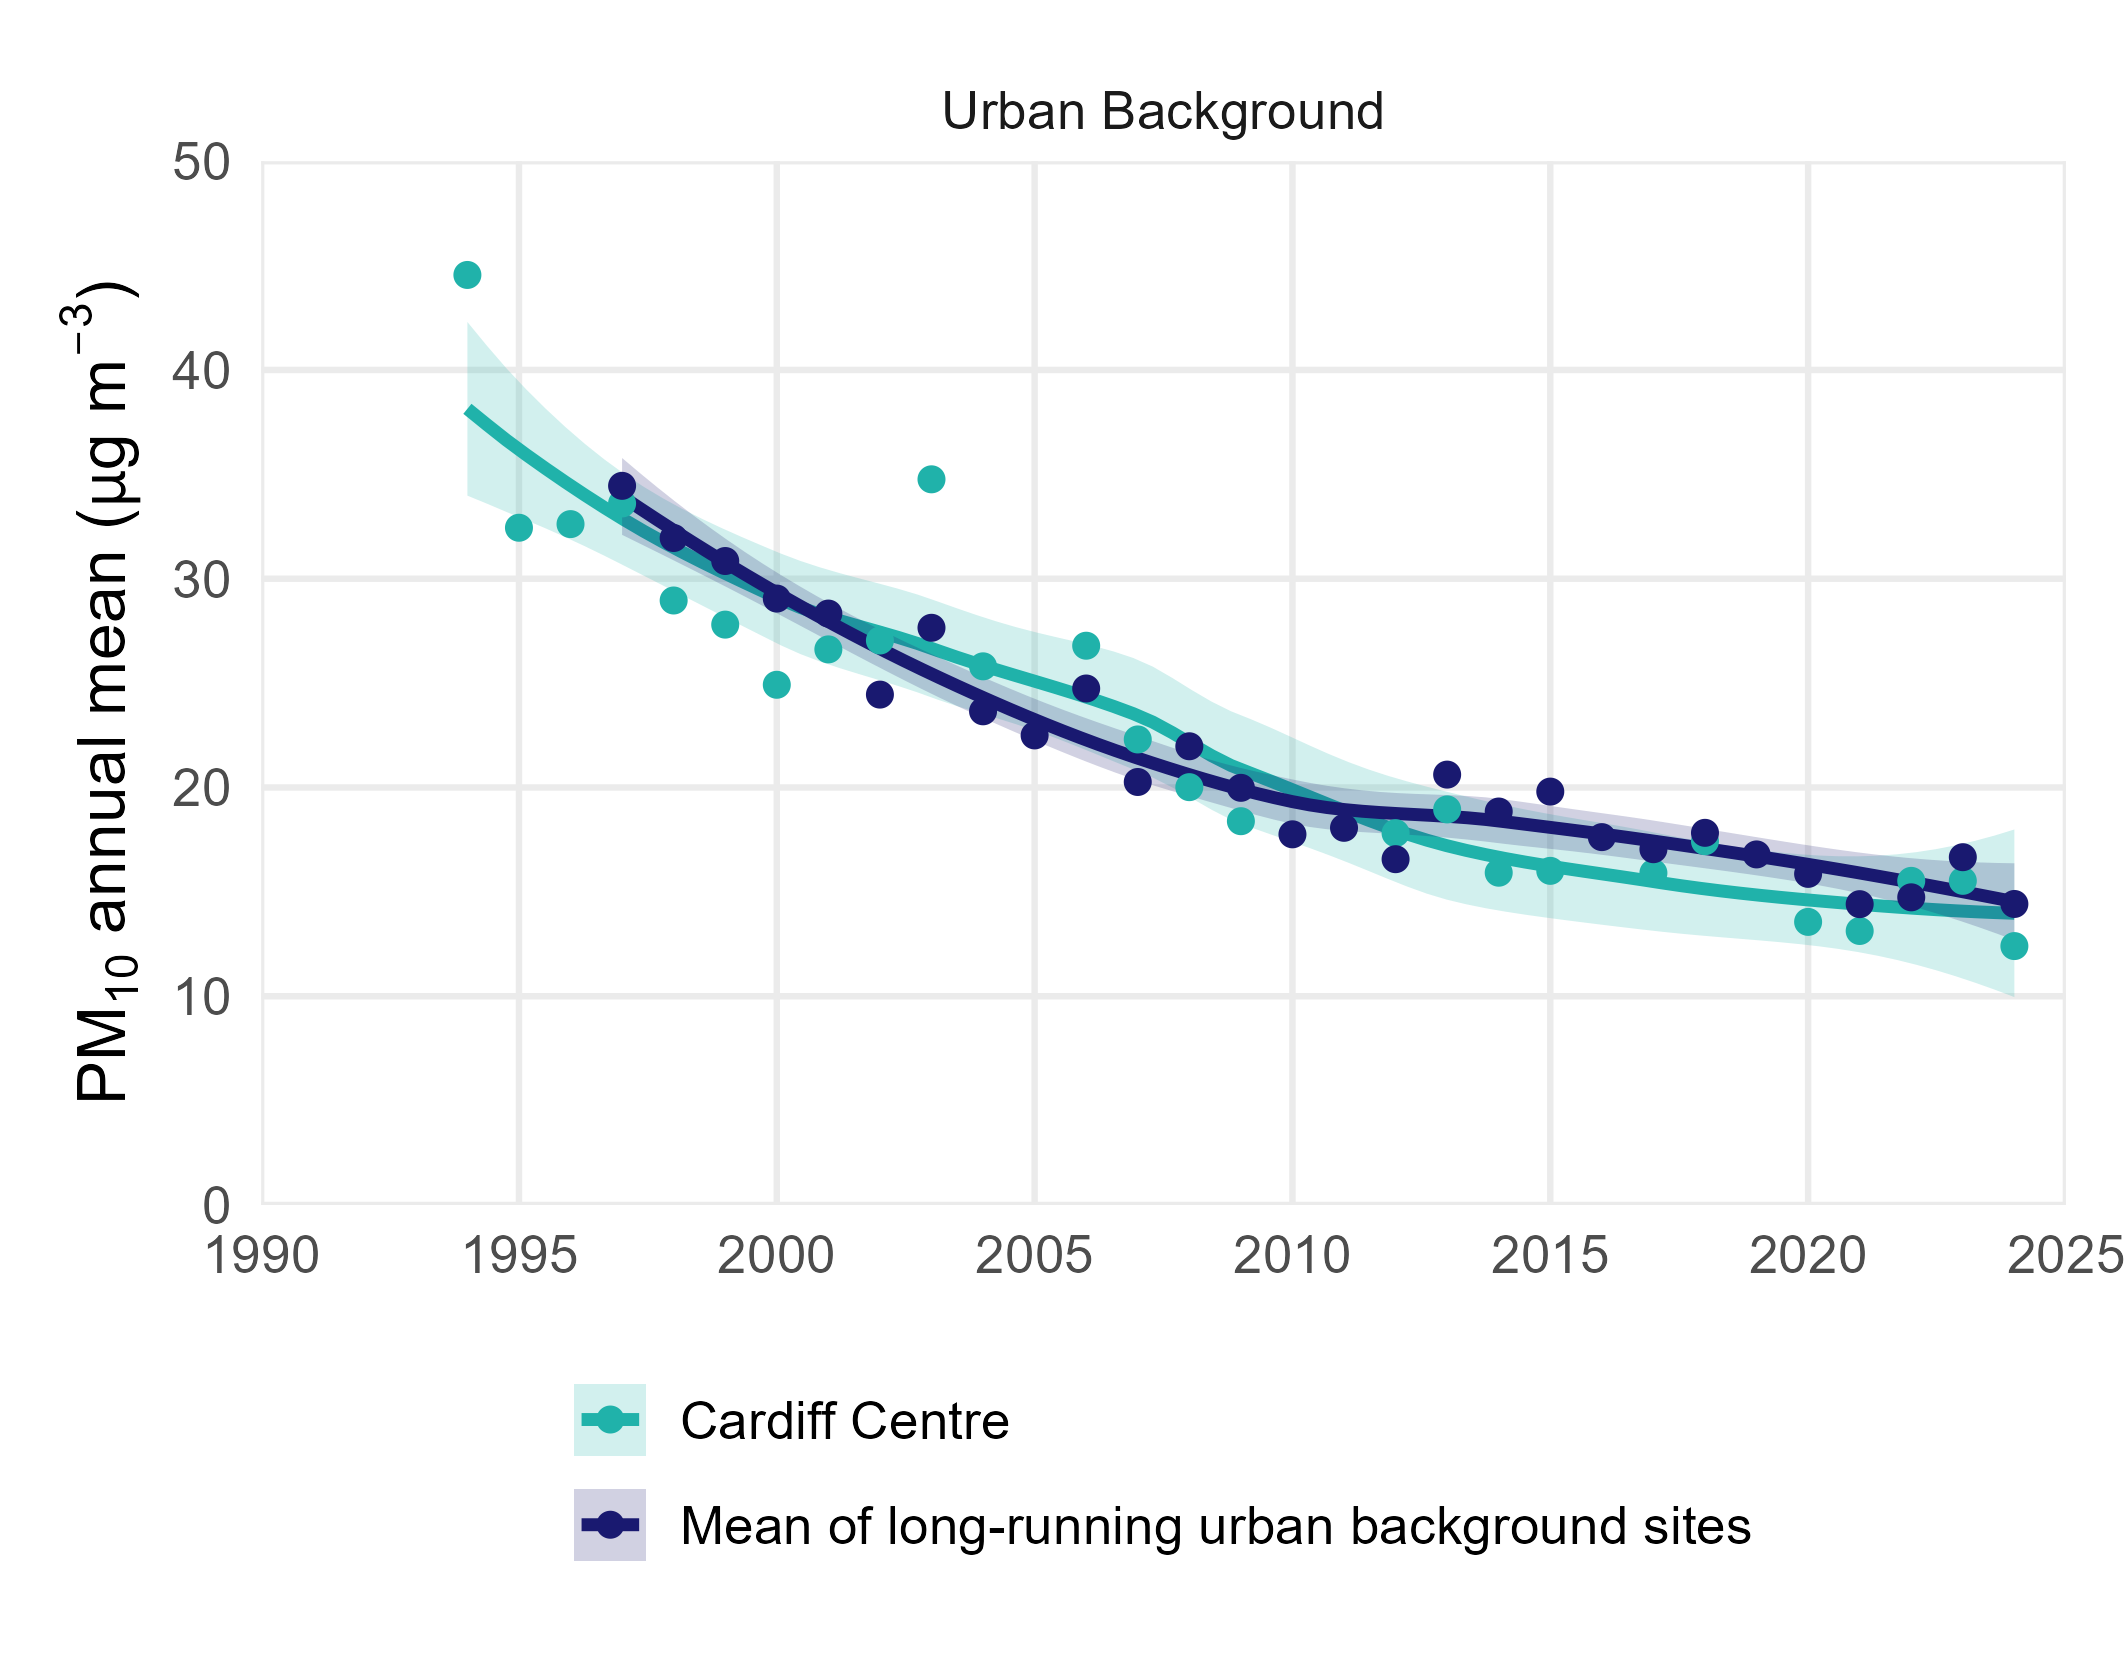
The figure below shows how annual mean concentrations of fine particles, PM10, have decreased in recent years at urban traffic sites. This is due to the diverse range of sources contributing to Particulate matter, of which vehicle emissions have been most substantially reduced in recent years. Urban background sites concentrations have been stable in recent years.
The annual mean PM10 concentrations at urban background sites, is represented by the longest-running site of this type (Cardiff Centre) and the average all long-running sites. Urban traffic site concentrations are represented by the longest-running PM10 site of this type, Wrexham, and the mean of all long running sites.

PM2.5
Urban PM2.5 sites in figure below are represented by the mean of long-running urban background sites. In general, the annual average concentrations of PM2.5 have shown little variation since records began in 2008, remaining virtually unchanged since 2020.

Ozone
Due to the inverse photochemical relationship between tropospheric O3 and NOx (where NOx is high, O3 is low and vice versa), O3 concentrations tend to be highest at rural locations. Ozone concentrations can vary substantially between years because of the inter-annual variability in meteorology. Some variation from year-to-year is expected due to fluctuations in the occurrence of hot summer weather conditions which are associated with high O3 concentrations. Ozone concentrations tend to be highest at rural locations.
The graph below shows annual mean O3 concentrations at Aston Hill, the longest running rural monitoring site, Cardiff Centre a long-running urban site, and also the mean of all long running rural sites. Over the years, an overall upward trend in rural O3 concentrations is evident. Highest annual mean rural ozone concentrations were recorded in 2006, coinciding with a record-breaking European heatwave. In 2024, the average annual O3 concentration of 62.8 µg/m³ which is a decrease compared to 2022 and 2023.
The Cardiff Centre urban monitoring site shows an even more marked long-term increase in annual mean ozone, reflecting the inverse relationship between O3 and NOx described above. As NOx concentrations have decreased at urban sites such as Cardiff Centre the levels of O3 have correspondingly increased.
